Temperature Compensation strategy
Tutorial
Temperature Compensation strategy for SENSORADE sensors
The temperature compensation (TC) method enables SENSORADE sensors to give a pressure measure that is compensated by the temperature. Indeed, the pressure sensor is a wheastone bridge (see Figure 1) where the outpout voltage (Vout span = Vout+ – Vout-) represents the level of pressure and the resistance of the bridge (R = (R1+R2) * (R3+R4)/(R1+R2+R3+R4)) represents the level of temperature.
To access this information, we make various measurements of the voltage’s output using the information provided by the deformation of the membrane. The latter deforms all the 4 resistances at the same time and therefore their values change at the image of the deformation of the membrane, as illustrated in Figure 2. The measure is made in known conditions of pressure and temperature (in a fixed range of temperature – from a minimum to a maximum value).
The objective of this tutorial is to present the possible strategy for measuring and or compensate the effect of the temperature. The following is an overview of the 4 possible options that can be done at your facilities*:
- 4 wires technique,
- 6 wires technique – Pressure sensor driven by current
- 6 wires technique – Pressure sensor driven by voltage
- 6 wires technique – Pressure sensor driven by voltage via a SENSORADE Box
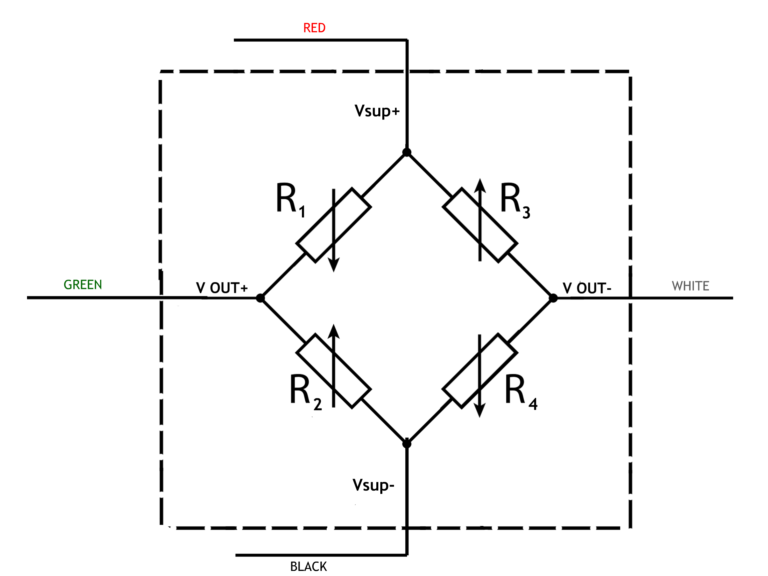
Figure 1: Wheatstone Bridge - 4 wires
Figure 2: MEMS deformation
i. 4 wires technique
This method is best fitted when the application does not require high accuracy and/or does not have to sustain large temperature variation. In this case, we provide one curve to the user (Figure 3).
Equipment needed: an accurate power supply source, and an accurate Voltmeter.
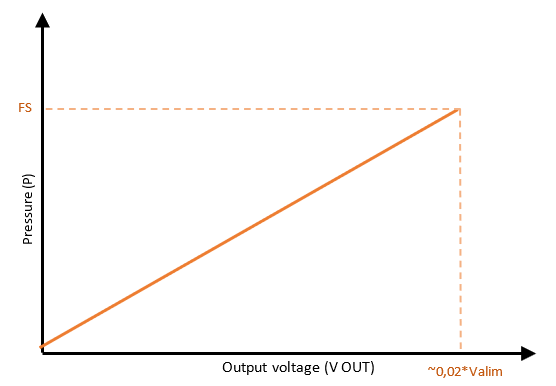
Figure 3: Output voltage of the sensor according to the pressure
ii. 6 wires technique (current driven sensor)
For this method, we implement on the sensor two more wires that enable the access to a temperature at ±0.75°C value so that it is compensated. Measurements are made at different temperature levels. This solution is the most acurate one, and can additionnally give the temperature measure.
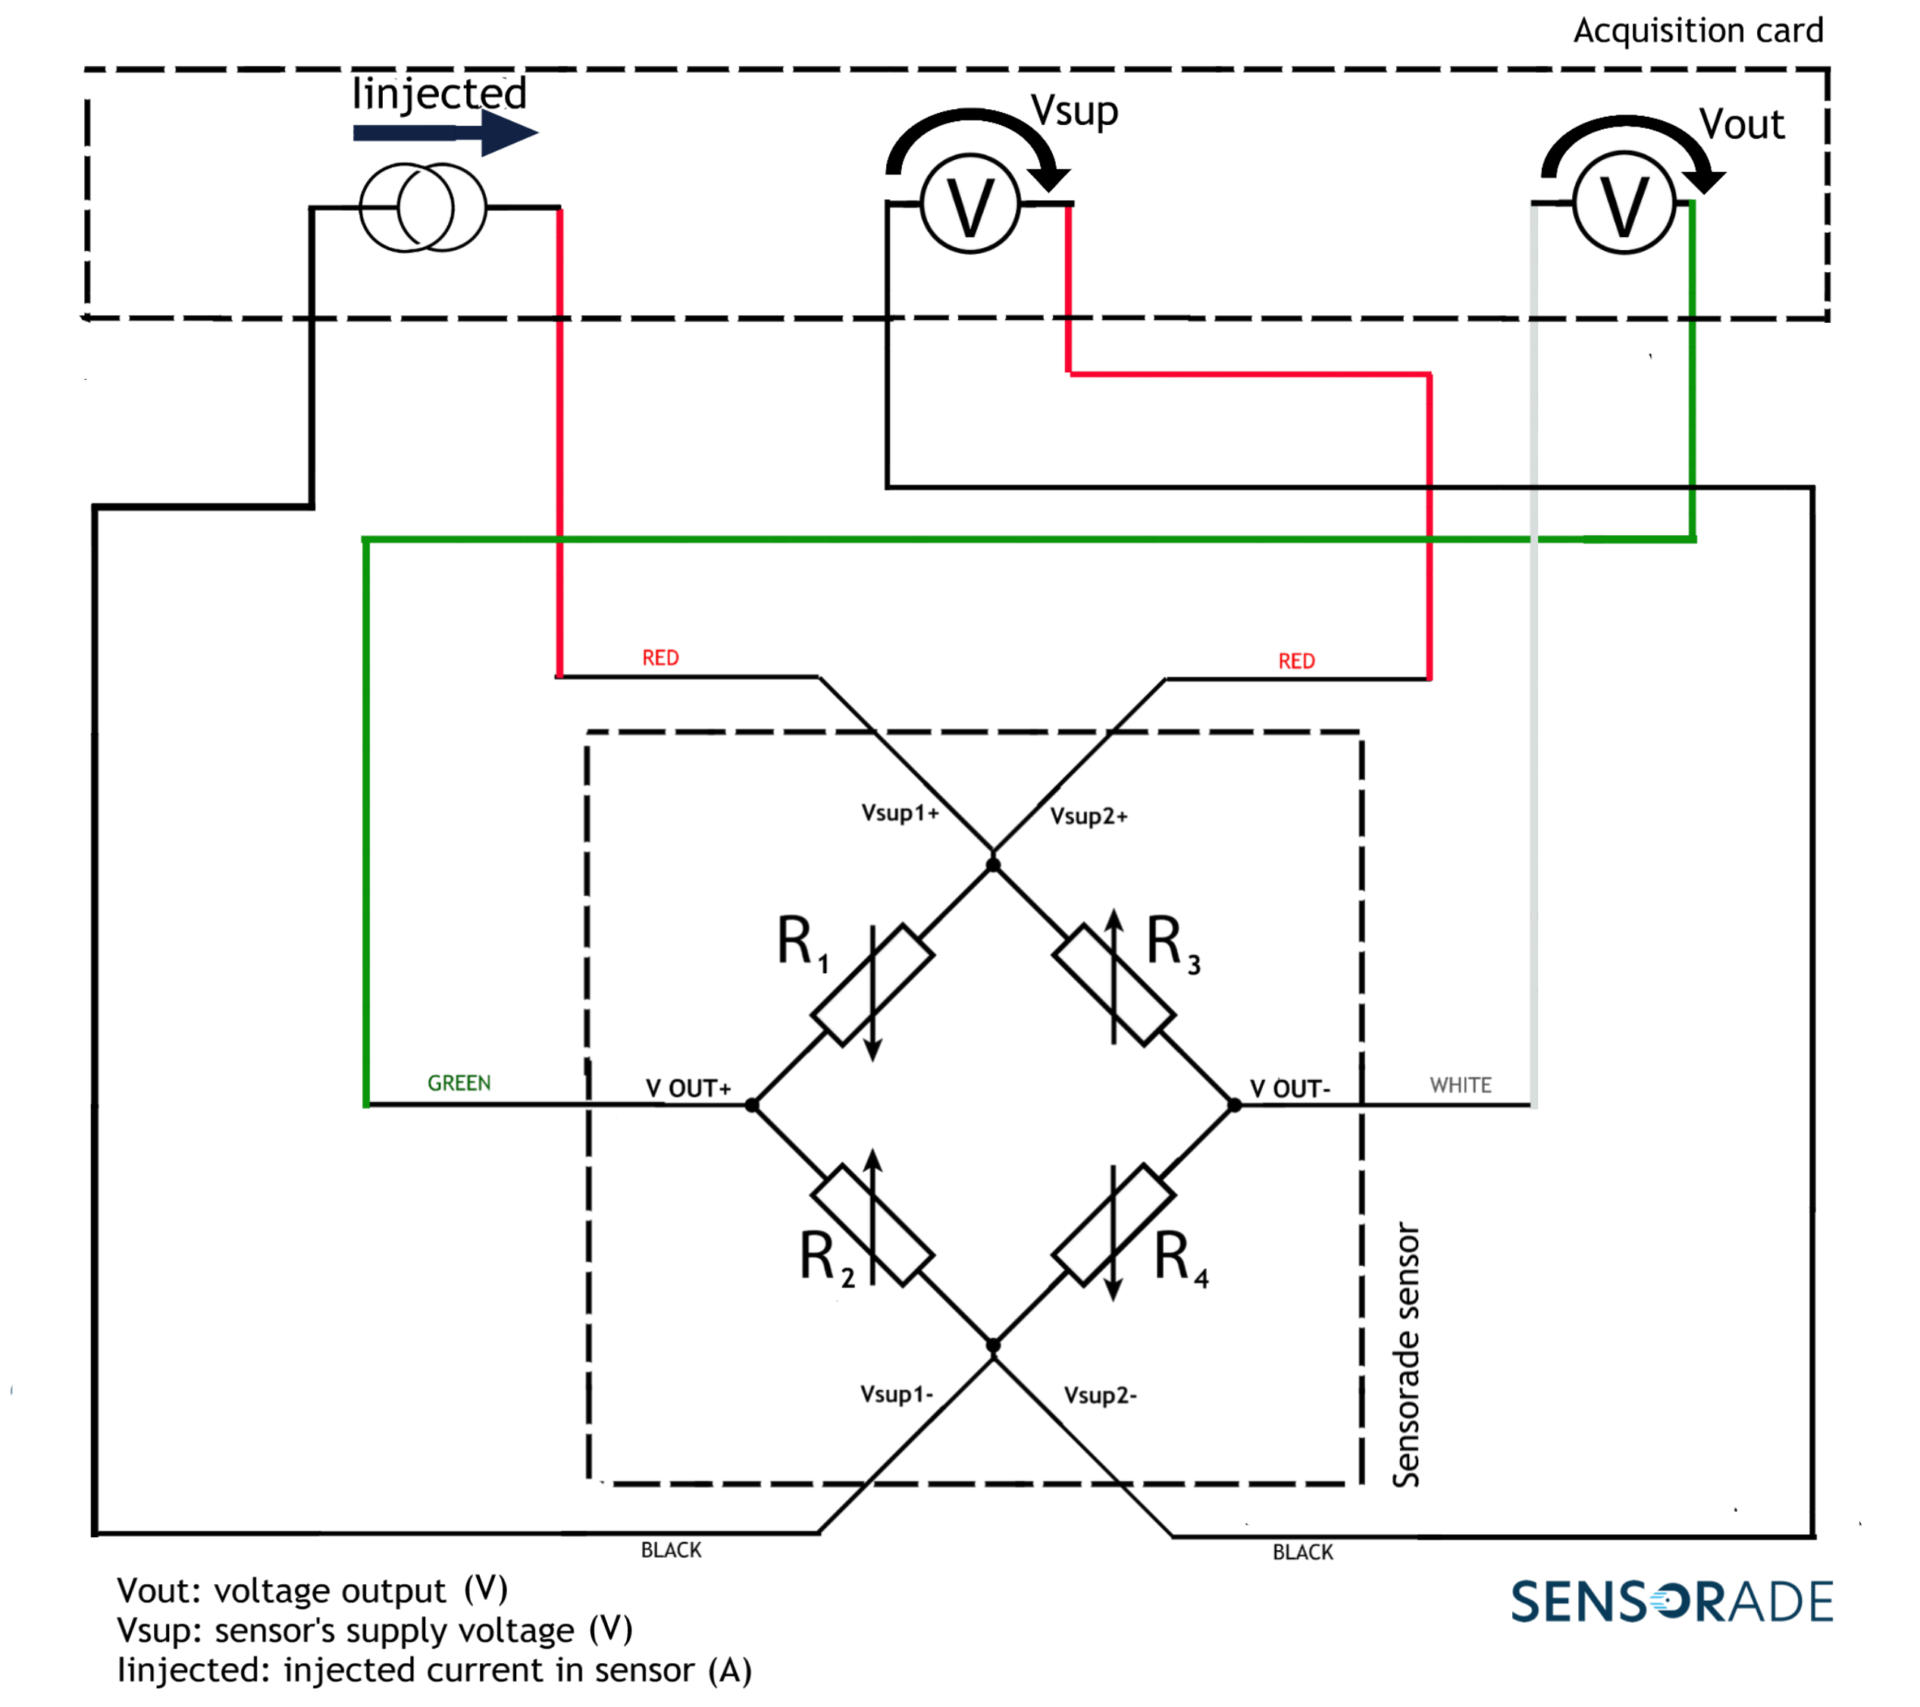
This solution is best illustrated with a Wheatstone bridge circuit diagram (Figure 4). We have 2 wires for positive supply ( Vsup1+ and Vsup2+), 2 wires for negative supply (Vsup1- and Vsup2-) and 2 wires for the output of the sensor (Vout+ and Vout-) directly linked to the level of pressure applied on the sensor.

Figure 4: Wheatstone Bridge - 6 wires
Sub-option 1: Acquisition card with a current injector
We inject a known current and measure the supply voltage of the sensor to calculate the resistance of the Wheastone bridge. This resistance grants access to the information about the temperature and enables to compensate its effect. The acquisition scheme is shown below:
We provide two curves to the user:
- The 1st curve (Figure 5) gives information about the temperature according to the sensor’s resistance calculated using the formula:
R = Vsup * Iinjected, with
R= sensor’s resistance; I= injected current; Vsup= Vsup+ – Vsup- (which is the measurement of the sensor’s voltage supply). - Knowing the temperature, the 2nd curve (Figure 6) gives information about the pressure according to the voltage output (Vout+ – Vout-) and the measurement of the sensor’s voltage supply (Vsup) and also according to the sensor’s temperature that’s linked to the resistance. For each temperature level the curve (Vout/Vsup, P) is different which means that the user must know the operating temperature so that we can pre-balance the bridge at this value.
Equipment needed: an acquisition card with a current injector.
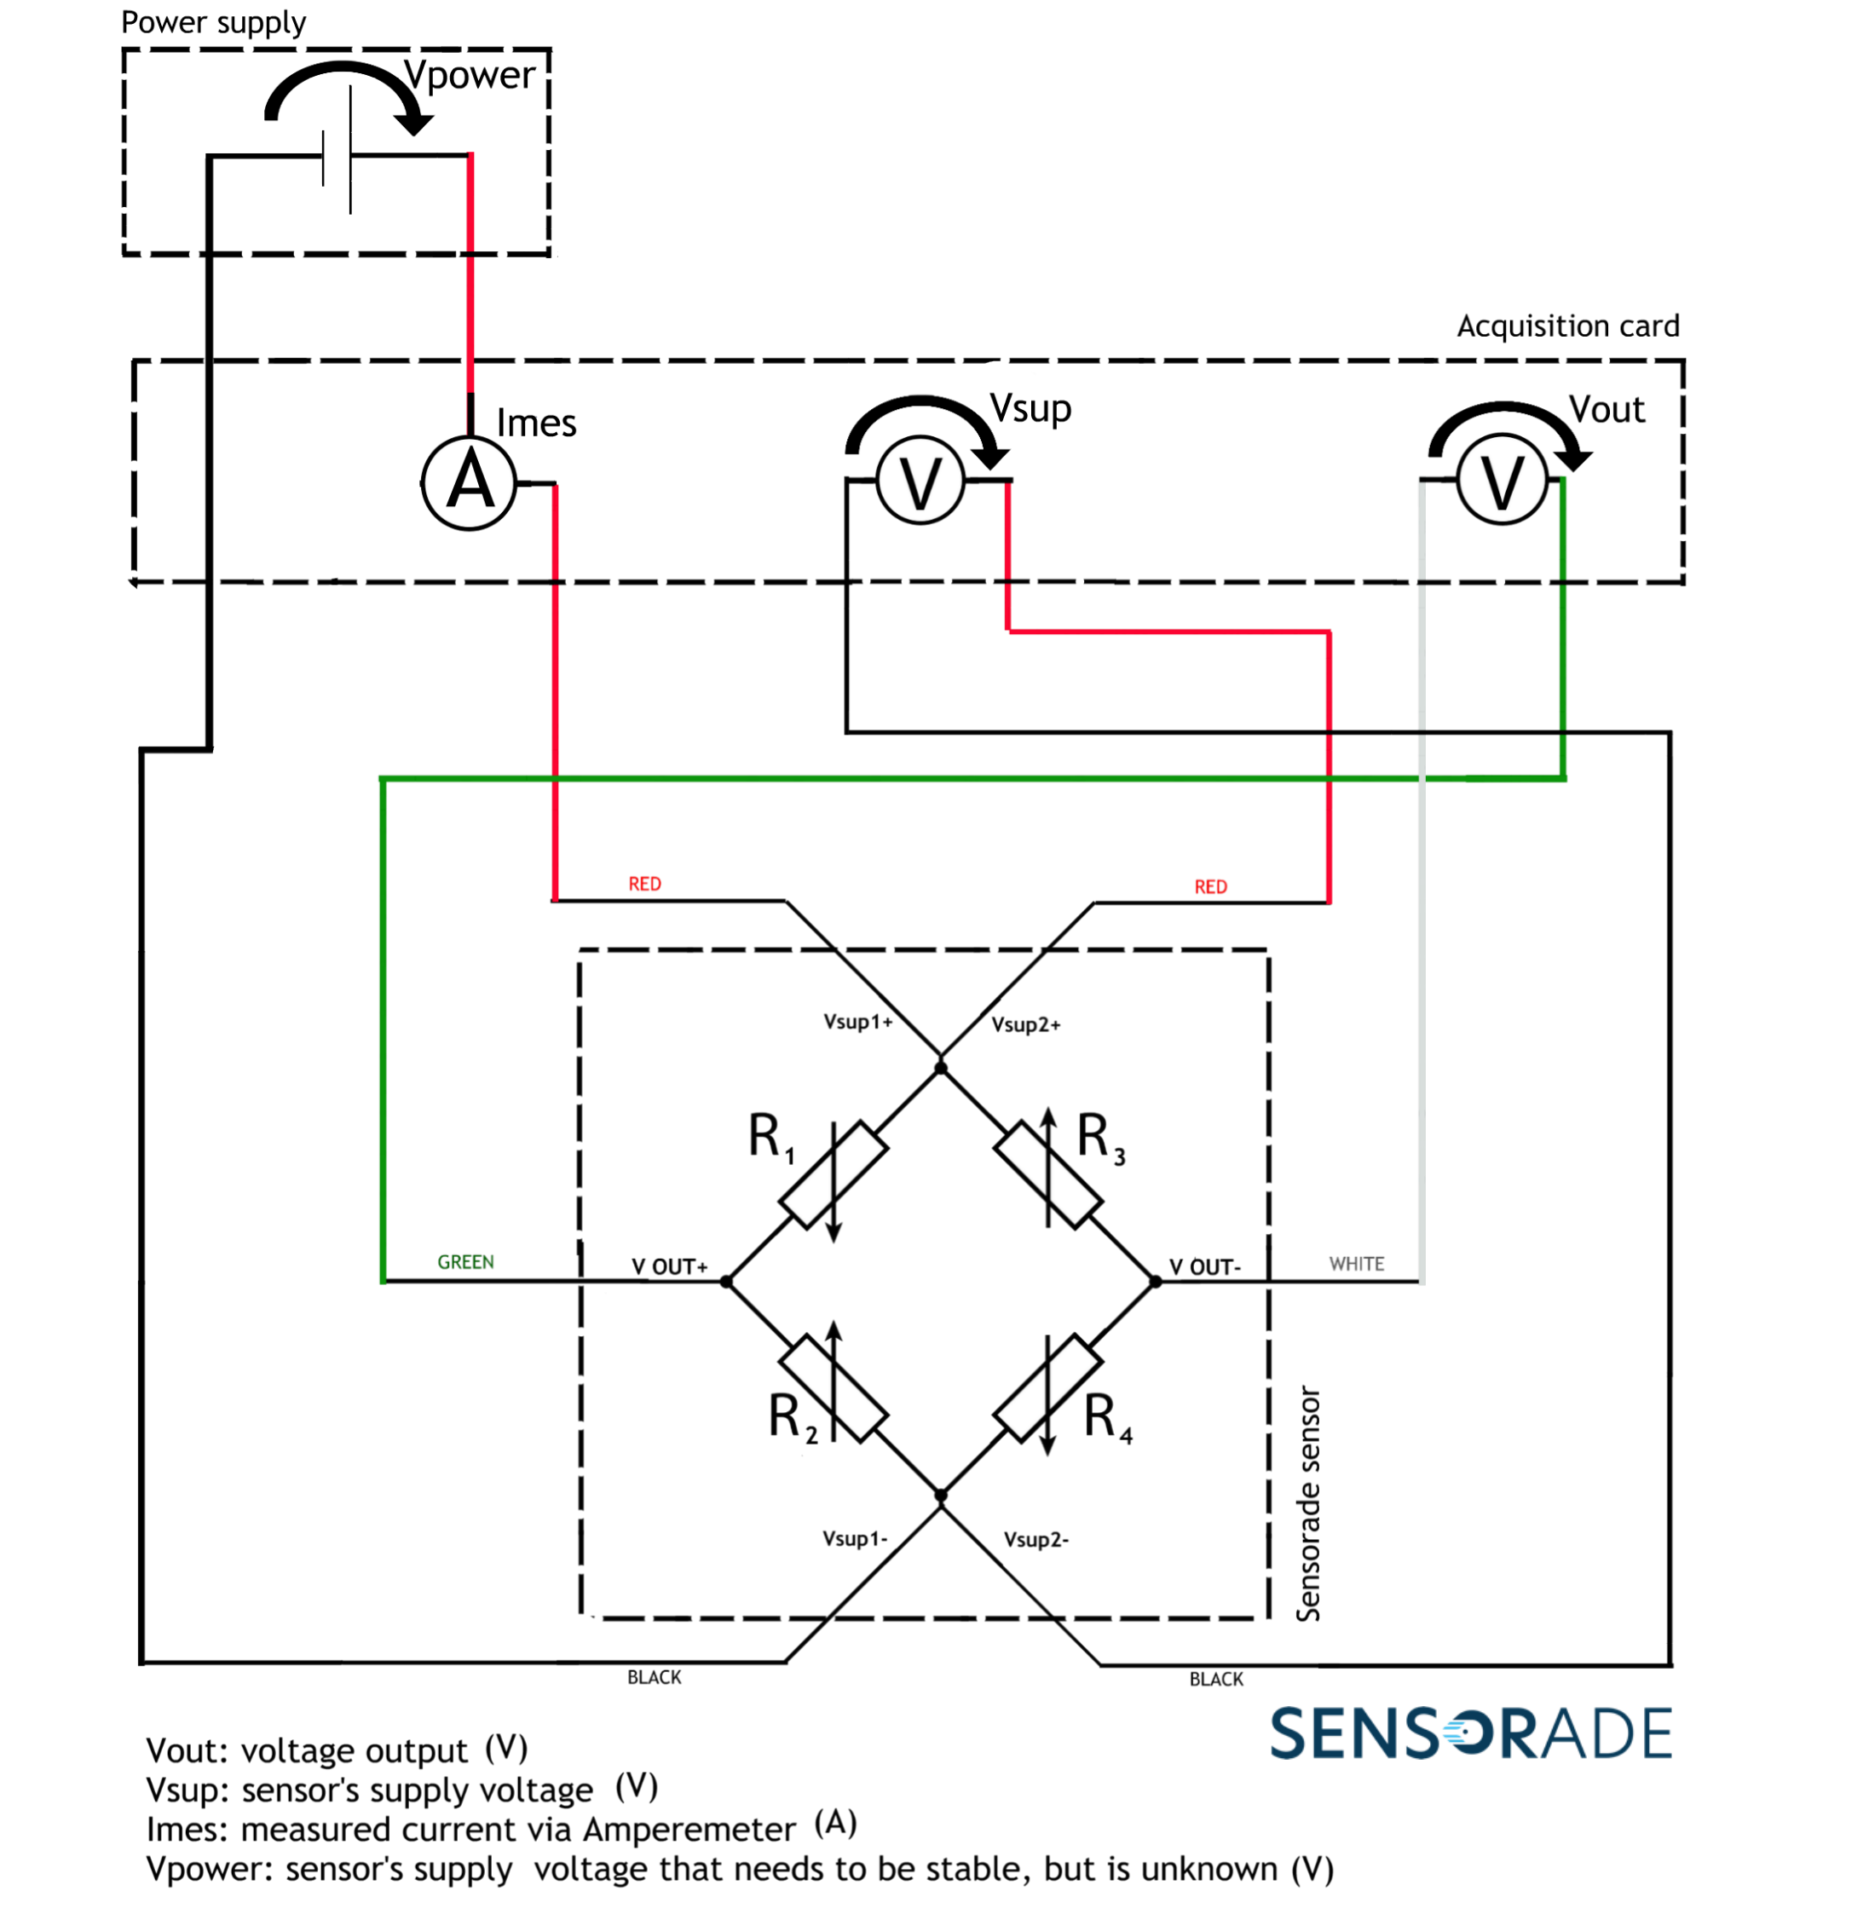
Sub-option 2: Acquisition card without a current injector but with an Amperemeter
We measure the current injected in the sensor and the supply voltage to calculate resistance of the Wheastone bridge. This resistance grants access to the information about the temperature and enables to compensate its effect. The acquisition scheme is shown below:
We provide two curves to the user:
- The 1st curve (Figure 5) gives information about the temperature according to the sensor’s resistance which is calculated using the formula:
R= Vsup * Imeasured, with
R= sensor’s resistance; I= measured current via Amperemetre; Vsup= Vsup+ – Vsup- (which is the sensor’s supply voltage). - The 2nd curve (Figure 6) gives information about the pressure according to the voltage output (Vout+ – Vout-) and the measurement of the sensor’s voltage supply (Vsup) and also according to the sensor’s temperature that’s linked to the resistance. For each temperature level the curve (Vout/Vsup, P) is different which means the user should be set on the right temperature.
Equipment needed: an acquisition card with an Amperemeter.
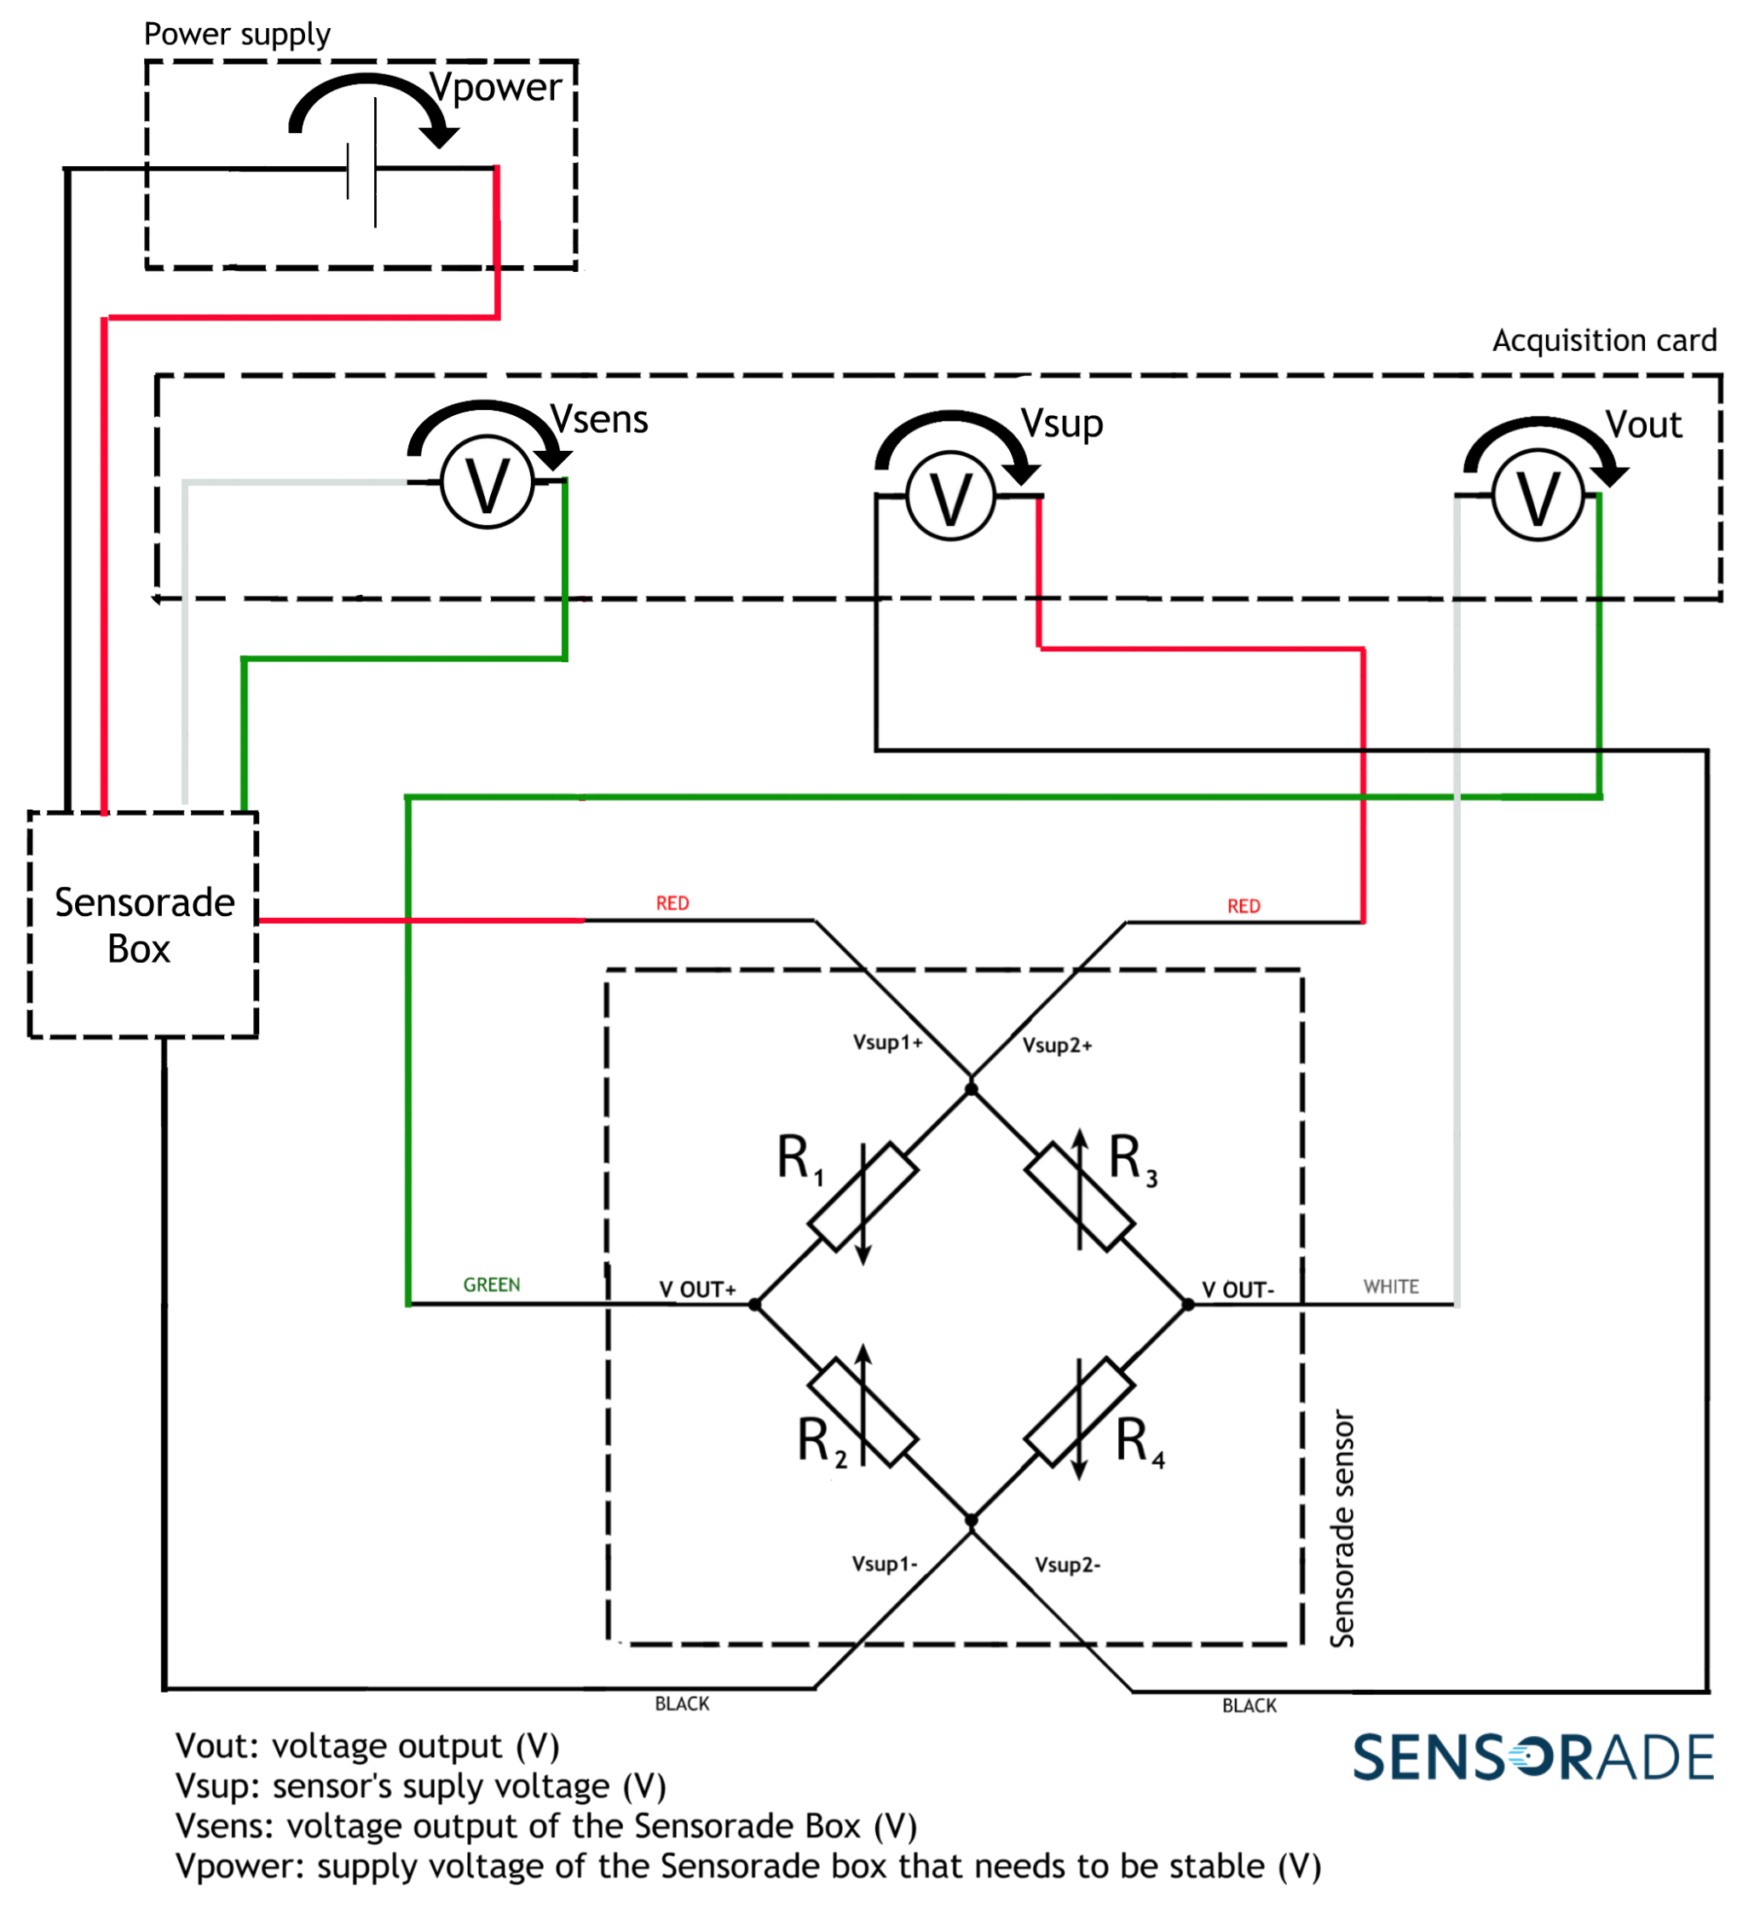
Sub-option 3: Acquisition card without a current injector but with a SENSORADE box
In substitution of the current injector or Amperemeter, SENSORADE proposes the SENSORADE BOX: it is a device to place at the entrance of the acquisition card that allow voltage supply for the sensor. Its output is a voltage wich allows you to know the current through the sensor. With these information and the supply voltage you can calculate the sensor resistance (wheastone bridge). This resistance grants access to the information about the temperature and enables to compensate its effect. The acquisition scheme is shown below:
We provide two curves to the user:
- The 1st curve (Figure 5) gives information about the temperature according to the sensor’s resistance which is calculated using the formula
R= f (Vsup, Vsens) = (Vsup * Isens), with
R= sensor’s resistance; Vsup= Vsup+ – Vsup– (which is the measurement of the sensor’s voltage supply); Vsens= sensorade output voltage (which represents an image of the current); Isens= calculated current (formula given with the SENSORADE Box) - The 2nd curve (Figure 6) gives information about the pressure according to the voltage output (Vout+ – Vout-) and the measurement of the sensor’s voltage supply (Vsup) and also according to the sensor’s temperature that’s linked to the resistance. For each temperature level the curve (Vout/Vsup, P) is different which means the user should be set on the right temperature.
The advantage of having a SENSORADE BOX is the ability to work with an acquisition system without a current injector.
Equipment needed : an acquisition card, a SENSORADE BOX.
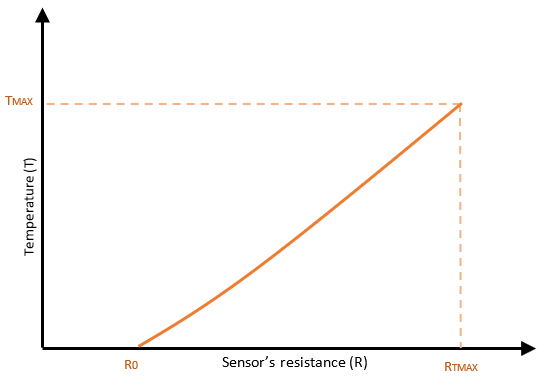
Figure 5: Sensor's resistance according to temperature
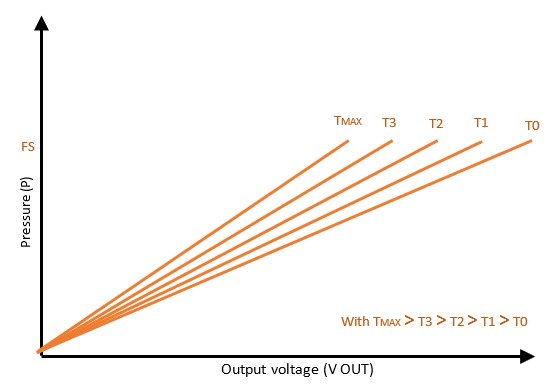
Figure 6: Output voltage of the sensor according to pressure
*Disclaimer: The data presented is not contractual and is directly influenced by the quality of the material used, the acquisition system, and the accuracy of the power supply source.